After looking at the results I posted in Part 3,
@GreaterThanPM Hmm. But if it's consistently lower (is it? Haven't looked at full results) then some effect must be missing, right?So what Sam is saying is that he observed that the PLAY from 2009-10, which can be thought of as expected assists for 2010-11, was always lower than actual assists from 2010-11, at least for the top 5 listed there. (Or maybe he meant PLAY from 2010-11... not sure). If PLAY is always lower for the top players, or always higher for the bottom players, that could indicate a problem with the model. It seems a little worrisome, so let's look into this further.
— Sam (@spamventura) August 4, 2013
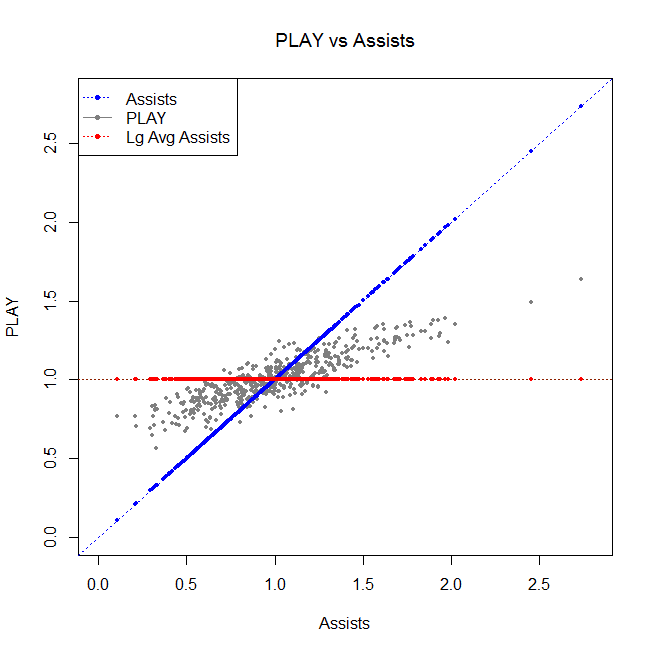
First, it makes sense that PLAY from 2009-10 is usually lower than assists from 2009-10 (the same season) for the league's top playmakers. If PLAY uses goals and shots, and using shots sort of has a regressing effect, pulling everyone towards the mean. So you can kind of think of PLAY as sort of a regressed version of assists. If instead we looked at the players in the bottom half of the league, we'd see that their PLAY is typically higher than their assists, because they are getting pulled up towards the mean. We can see that affect here:

Let's explain this figure a little. Each grey dot corresponds to a forward, and the vertical position of the dot indicates that forward's PLAY in 2009-10. Each blue dot along the blue line corresponds to the forward's assists per 60 minutes in 2009-10. The red horizontal line corresponds to the league average assists per 60 minutes in 2009-10.
Notice that a player's gray dot is typically between their blue dot and the red line, which means that a player's PLAY is typically between their own assists and the league's average assists. Players with above average assists (right half) get pulled down, and players with below average assists (left half) get pulled up.
This isn't always the case, because the model isn't just regressing, it's doing some other stuff too, like adjusting for strength of teammates. But there is a bit of a regression effect going on. So we expect PLAY from 2009-10 to be lower than assists in 2009-10 for the top players.
But is PLAY from 2009-10 is always lower than assists from 2010-11? In our top 5 list from Part 3, that appeared to be the case. Let's show just those two columns, and their difference:
2010-11 2009-10
       Player Pos Team       A     PLAY Difference
 Henrik Sedin   C  VAN      44       32         12
 Anze Kopitar   C  L.A      33       22         11
Claude Giroux  RW  PHI      33       17         16
 Daniel Sedin  LW  VAN      35       22         13
   Bobby Ryan  RW  ANA      28       19          9
                   (This table was taken from the paper and edited.)
In each case, PLAY predicted about 10 assists too low. But if we are going to check the model, we should look at this same table for the per 60 minutes version of each statistic. And we should sort by PLAY in 2009-10, not PLAY in 2010-11, because we are comparing PLAY from 2009-10 and assists from 2010-11.
Here are the top 10 PLAYers (capitalization and pun intended) from 2009-10, and their assists in 2010-11:
Fortunately, there is no noticeable trend of under- or over-estimating assists the next year. Some are over, some are under.
More discussion
If you aren't interested in regression model diagnostics, you might prefer to skip this section.
Here are the top 10 PLAYers (capitalization and pun intended) from 2009-10, and their assists in 2010-11:
2009-10 2010-11
            Player Pos Team    PLAY       A   Diff
      Henrik Sedin   C  VAN    1.63    2.21   0.58
      Daniel Sedin  LW  VAN    1.49    1.83   0.34
 Nicklas Backstrom   C  WSH    1.38    1.23  -0.15
      Joe Thornton   C  S.J    1.35    1.26  -0.10
      Paul Stastny   C  COL    1.34    0.95  -0.40
     Wojtek Wolski  LW  NYR    1.34    1.31  -0.03
       Scott Gomez   C  MTL    1.34    0.70  -0.64
 Mikhail Grabovski   C  TOR    1.32    1.08  -0.24
       Matt Stajan   C  CGY    1.31    1.43   0.11
      Ryan Getzlaf   C  ANA    1.31    1.72   0.42
Fortunately, there is no noticeable trend of under- or over-estimating assists the next year. Some are over, some are under.
More discussion
If you aren't interested in regression model diagnostics, you might prefer to skip this section.
If we go beyond the top 10, there is still no noticeable trend. Here is a plot of the Diff versus PLAY for all players. More precisely, we show the difference in the actual values and predicted values (assists in 2010-11 minus PLAY in 2009-10) in the vertical axis, and the fitted values (PLAY in 2009-10) along the horizontal axis:

The reason for all of the 10's in the first table is that the table was sorted by PLAY in 2010-11, not PLAY in 2009-10. PLAY in 2010-11 uses assists from that season, so PLAY from 2010-11 is correlated with assists from 2010-11. Sorting by PLAY from 2010-11 is sort of like sorting by assists in 2010-11.
Assists in 2010-11 were the y's in our model. If we say that when y is high, the residuals are high, that's exactly what is supposed to happen if our model isn't an amazingly good fit. The residuals will be correlated with y to some degree. In fact, the correlation is \sqrt{1-R^2}, where R^2 is the multiple R^2 from the original model.
So in any regression model that doesn't have a very high R^2, the residuals will be correlated with y to some degree. If we were to plot residuals vs y instead of residuals vs fitted values, we would expect to see a trend instead of the random blob of points like in the figure above.
Since assists are pretty noisy, and since they depend on things other than talent (like teammates, opponents, and zone starts) that might change from year to year, our model does not have a very high R^2. We are trying to predict something that's really noisy, and we get a lot of unexplained variation. Our R^2 is low-ish, which means \sqrt{1-R^2} is high, and y and our residuals are correlated.
But while PLAY isn't amazingly good at predicting assists, it is still better than assists at predicting assists. Plus, PLAY is more consistent than assists.
I guess another way to think of it is that PLAY tends to give conservative predictions, so when y is very high, residuals tend to be high as well.
Another note: it seems any model with assists as the outcome will be noisy. But do we have any other options?
ReplyDeleteIf we want statistical evidence that PLAY is useful, we have to show it is somehow better at doing something than existing statistics. So we've built PLAY so that it is better than assists at predicting assists. But is there something else we could check?
These results are much more in line with what I would have expected.
ReplyDeleteAlso, good call on sorting by PLAY and not by assists -- this definitely makes more sense in the context of what you're trying to show about PLAY. If you sorted by assists, then of course the top assist-getters would, for the most part, be underestimated.
This is why I qualified my tweet with "I haven't looked at the full results"!
Haha, indeed. It was a good observation. I, on the other hand, did have the privilege of having full results and yet I was still confused for a little after you asked about it because the trend continued well beyond the top 5 in the table. Then I realized I had to sort by PLAY in 2009-10.
ReplyDeleteAlso, excellent... the comments work for people other than me.